matplotlib and Raspberry Pi 3 - show my 'Hello world!'
17 April 2018
Here it is: I have tried to do simple plot using matplotlib on freshly installed Raspbian (jessy).
Way to accomplish this seemingly easy task is quite bumpy thou. This post serves to document the steps i have done to see the plot first time.
1. grab a Raspberry Pi and all peripherals
2. If you have an NOOBS SD card, install Raspbian, if not, visit https://www.raspberrypi.org/downloads/noobs/ and download NOOBS, follow the installation procedure.
3. Raspbian installed? Great. This is Linux named Debian, to quickly check what you have installed open terminal and type
lsb_release -a
As answer you obtain something like:
Distributor ID: Raspbian
Description: Raspbian GNU/Linux9.4 (stretch)
Release: 9.4
Codename: stretch
Start from typing a command:
sudo apt-get update
Check the python version you have by typing in terminal
python
or
python3
first line appearing after this command tells about installed version(s) of python.
Next, it is worth to have two packages installed. Their names are: python3-dev and libffi-dev. To install, open terminal and go with:
sudo apt-get install python3-dev
and
sudo apt-get install libffi-dev
Now, time for matplotlib installation. Follow the matplotlib webpage installation instruction. Link https://matplotlib.org/users/installing.html
If you need matplotlib for Python2.7 you will also need subprocess32.
All fine, last step to be done: backend for matplotlib. I found it very exhausting trying to work with cairo. This seem to be a default backend for matplotlib. To change it, run the python kernel, and >>>import matplotlib
then type
>>>matplotlib.matplotlib_fname()
What you will get is a path to matplotlibrc file, which is a configuration file for matplotlib. Now,
sudo nano path_to_matplotlibrc
and find a line starting with 'backend'. My was looking like this:
backend : gtk3agg
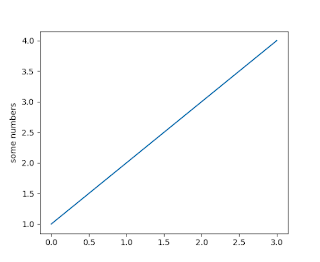
I have changed it to tkagg, and from now simple 4-liner does work:
>>import matplotlib.pyplot as plt
>>plt.plot([1,2,3,4])
>>plt.ylabel('some numbers')
>>plt.show()
Useful info: To check what type of device you are using, in terminal type:
cat /proc/device-tree/model
my Rpi gives answer of:
Rapspberry Pi 3 Model B Rev 1.2
There is a possibility to try terminal command
pinout


I tried this in a remote session with real-vnc.
ReplyDeleteAt the end the plt.show() command does not show anything.
Can yue explain why?